Blogs
Renewable Energy, Solar Panel Installation Ghana, solar panel integration, solar power Ghana, Solar Power Systems
Solar vs. ECG Ghana: The 30-Year “Wealth Gap” Cost Comparison (2011–2041)

This 30-year perspective is the most powerful way to see the impact of energy costs on your personal wealth. By combining the past 15 years of actual price hikes with a conservative 15-year future projection, we can see the full “Wealth Gap” that solar energy creates in Ghana.
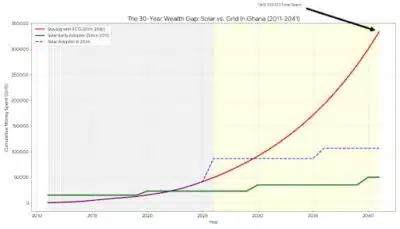
The 30-Year Wealth Gap (2011–2041)
This graph compares three paths a Ghanaian household can take:
- The Grid-Dependent (Red Line): Someone who started paying ECG in 2011 and never switches.
- The Early Adopter (Green Line): Someone who spent GHS 15,000 back in 2011 to go solar.
- The New Adopter (Blue Line): Someone who stayed with ECG for the first 15 years but finally switches to solar in 2026.
What the Graph Tells Us:
- The Past (2011–2026): You can see how the “red line” (ECG) started climbing sharply after 2015. By 2026, the person who stayed on the grid has already spent significantly more than the “Early Adopter” who spent GHS 15,000 upfront.
- The Future (2026–2041): This is where the gap becomes life-changing. Because grid prices are rising by an average of 10% or more each year, the “red line” curves upward like a rocket. By 2041, the grid-dependent household will have spent nearly GHS 800,000 on electricity alone.
- The “Ama” Factor (The Blue Line): Even if you missed the boat in 2011, switching in 2026 (the blue dotted line) still saves you over GHS 500,000 compared to staying on the grid until 2041.
The Bottom Line:
Energy in Ghana is not just an expense; it is a drain on your lifetime wealth. The green and blue lines represent thousands of Cedis that stay in your pocket, which could be used for retirement, children’s education, or starting a business.
Related Posts
The “Silent Tax”: Why Your ECG Bill is Your Biggest Financial Leak
Think back to 2011. A bottle of water was cheap, the Cedi was resilient, and your monthly electricity bill was likely the least of your...

Can I really run my AC, water pump, and freezer all at the same time on solar?
The answer is Yes—but only if you understand Surge Power. If you undersize your inverter, your system will trip the moment your pump ki...
Solar ROI: Payback Period and Long-Term Savings in Ghana
Solar ROI is crucial as Ghana moves toward a more sustainable future. Solar energy is gaining popularity as a solution for homeowners a...

Solar Water Heaters: Cut Your Energy Bills and Save More
Solar Water Heaters are becoming an essential solution as global energy costs rise. Many homeowners are looking for ways to reduce util...
The Role of Solar Energy in Ghana’s Net-Zero Goals
The Role of Solar Energy in Ghana’s transition to a sustainable future has never been more significant. With climate change posing seri...
Debunking Solar Energy Myths in West Africa
Debunking Solar Energy Myths is essential as solar energy has become one of the most promising solutions for tackling energy shortages ...
Women Leading the Solar Energy Revolution in Ghana
Women Leading Ghana's Solar Energy Revolution have been instrumental in the country’s renewable energy shift. Traditionally dominated b...
Small Business Solar Energy in Ghana: Costs & Benefits
Small Business Solar Energy: As Ghana’s economy grows, small businesses are vital to driving economic progress. However, rising energy ...
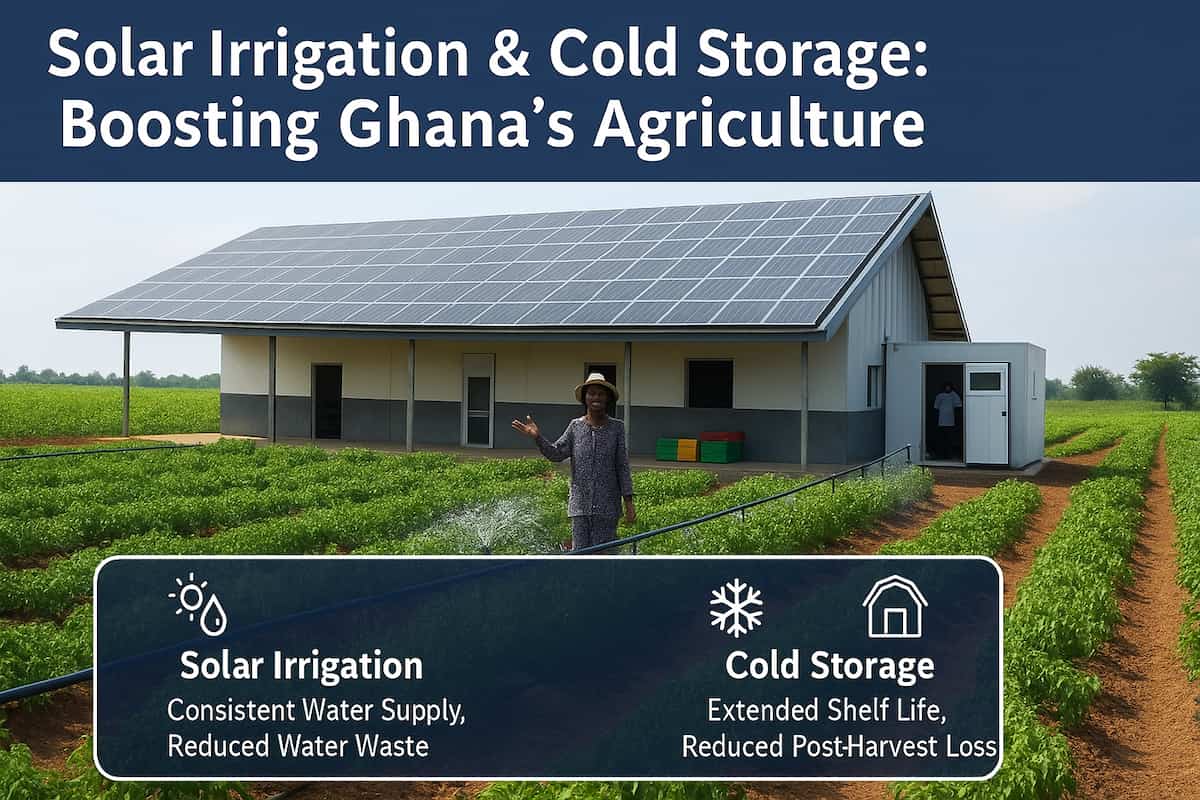
Solar Irrigation & Cold Storage: Boosting Ghana’s Agriculture
Solar irrigation and cold storage play a crucial role in transforming Ghana’s agricultural landscape. Agriculture is a cornerstone of G...
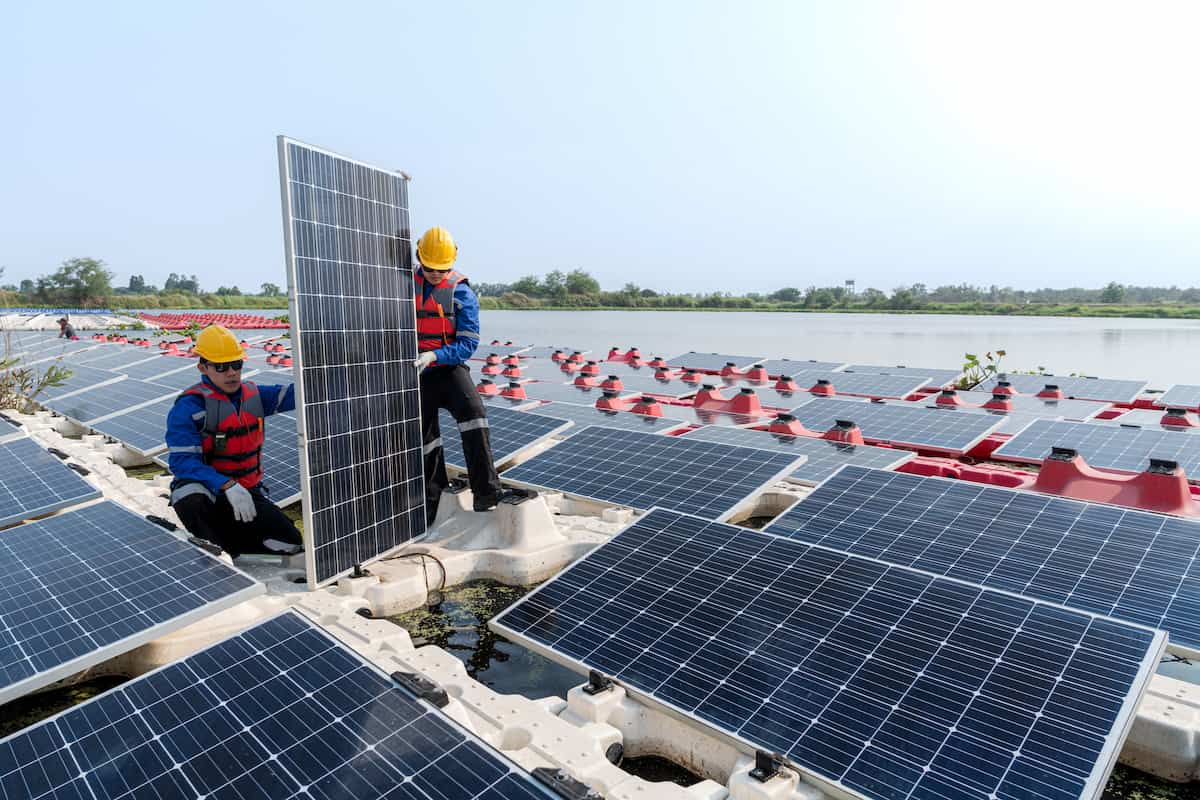
Floating Solar Farms: Viability in Ghana’s Water Bodies
Floating Solar Farms are innovative renewable energy systems that generate electricity from solar panels installed on water bodies, hel...
Solar financing Options for Ghanaians in the UK
Imagine supporting your family in Ghana from the UK, providing them with reliable solar power. With Solar Financing Options, you can ea...
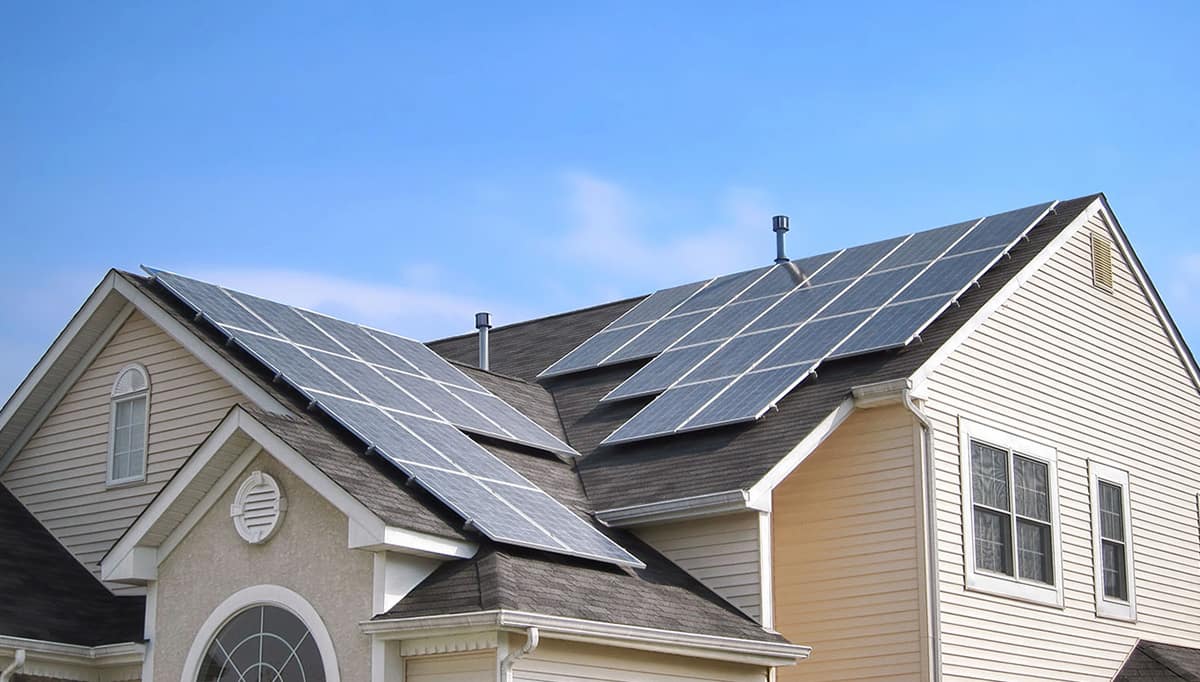
Ghana’s Renewable Energy Policy: Home Solar
Discover how Ghana's renewable energy policy is transforming home energy use. Learn about government incentives, solar subsidies, and ...